Full Text
Introduction
Liver is a common site for various benign or neoplastic primary lesions and distant metastases of cancers originating from other organs. Liver cirrhosis is often complicated by hepatocellular carcinoma. Modern operative techniques and local therapies such as radiofrequency (RF) ablation are effective methods to treat liver metastases or primary hepatic malignancies [1]. Therefore, the determination of liver lesion count, and the nature of the lesion are important.
The incidence of Hepatic cancer in India was 3.71 per 1, 00,000 population in males and 0.84 per 1, 00,000 population in females in the year 2004 [2]. Amongst all the cancers in India, hepatic cancer has the highest mortality rate of 12.90 per 1, 00,000 population and the DALYs lost are 82,436 in males [3]. In females, hepatic cancers has mortality rate of 0.59 per 1, 00,000 population and the DALYs lost are 29,182 [3]. The estimates for the year 2008 were 62,000 deaths in South-east Asia due to hepatic cancer and global deaths were estimated upto 695,000 secondary to hepatic cancers [4]. With the increasing incidence of chronic liver diseases secondary to hepatitis B and C viruses, the incidence of hepatic cancers is expected to rise many folds in the years to come.
Today, focal hepatic masses are diagnosed using ultrasonography (USG) and/or computed tomography (CT). Additionally, magnetic resonance imaging (MRI) is preferred when further characterization of these masses is needed. MRI has many advantages (e.g., high contrast resolution, the ability to obtain images in any plane, lack of ionizing radiation, and the safety of using particulate contrast media rather than those containing iodine) that make it a favored modality. Lesion morphology, signal intensity, and contrast enhancement pattern are taken into consideration when characterizing masses with MRI; however, even if the data are evaluated together, there can still be difficulties in the differentiation of benign and malignant lesions.
The contrast between tissues on MR images depends mainly on differences in their T1 and T2 relaxation times and proton densities. Basic techniques such as spin echo (SE) or gradient echo (GE) sequences can be used for imaging to obtain high contrast images. Additionally, there are a number of other methods to manipulate MR contrast in order to enhance signal differences between normal and pathological tissues.
Usefulness of Diffusion weighted magnetic resonance imaging (DWI) in brain evaluation is long known, particularly in cases of brain parenchymal ischemia. Its usefulness in body imaging is a topic of research all over the world in recent times.
Diffusion weighted imaging (DWI) is another mechanism for developing image contrast and relies on changes in the diffusion properties of water molecules in tissues [5].
Diffusion is the result of thermal fluctuations with a random pattern and this is often referred to as “Brownian motion”. Diffusion-weighted magnetic resonance imaging (DWMRI) is a new technique of magnetic resonance imaging (MRI) at the level of molecular movements and can reflect the functions and structures of the tissue without trauma. It has been used to diagnose diseases in the central nervous system. Diffusion-weighted single-shot echo-planar imaging is known for itshigh contrast resolution. It has been reported that this sequence depicts not only hyperintense fresh brain infarctions but also hyperintense malignant hepatic tumors.
Diffusion-weighted (DW) magnetic resonance (MR) imaging provides potentially unique information on the viability and physiological state of hepatic tissue. Diffusion-weighted MR imaging is the simplest form of diffusion imaging. It provides image contrast that is dependent on the molecular motion of water, which may be substantially altered by disease. We use a spin-echo T2-weighted pulse sequence with two extra gradient pulses that were equal in magnitude and opposite in direction. This sequence enabled the measurement of net water movement in one direction at a time.
Images obtained with gradient pulses applied in one direction at a time are combined to create DW images or ADC (apparent diffusion coefficient) maps. At low diffusion weighting, there is minimal sensitivity to diffusional motions and images will show predominant T2 contrast. At high diffusion, the contrast is largely produced by the diffusional properties.
This paper is intended to share our initial experience regarding use of Diffusion weighted MRI in characterization of focal hepatic lesions.
Materials and methods
Period of study: May 2012 to May 2013
Patients for the study were chosen from patient population referred for MR imaging of liver to Department of Radio-Diagnosis, Krishna Institute of Medical Sciences (KIMS) Hospital, Secunderabad.
Sample size: 30 patients with focal liver lesions were studied.
Method of collection of data (including sampling procedure if any)
Diagnosis on MRI was made with background of clinical context.
Final diagnoses was reached in consensus with biopsy/FNAC, wherever applicable or clinical, laboratory, other imaging modality findings and follow up.
Inclusion criteria
The study included:
- All patients referred for MRI with clinically suspected focal liver lesions and patients with indeterminate liver lesions detected on USG or CT.
- Incidentally detected focal liver lesions.
- Patients with focal liver lesions in whom histopathological confirmation of the diagnosis is available.
- Patients diagnosed to have primary malignancy of other organs and suspected hepatic metastasis.
Exclusion criteria
The study excluded:
· Patients with focal liver lesions <5mm where exact placement of ROI was not possible for accurate assessment of ADC values.
· Patients with motion artifacts that interfered with optimal assessment.
· Patients with no definitive diagnosis of focal liver lesions.
· All patients having cardiac pacemakers, prosthetic heart valves, cochlear implants or any metallic implants.
· Patient having history of claustrophobia.
· All patients who do not consent to be a part of the study.
Data analysis
Results expressed as mean, standard deviation, number and percentages.
One-way ANOVA test was used for multiple group comparison and student unpaired “t” test for 2 group comparison.
One-way ANOVA test was used to calculate the strength of a particular “b” value regarding its ability to differentiate between focal liver lesions based on their ADC values.
Unpaired “t” test was used to calculate the strength of a particular “b” value regarding its ability to differentiate between benign and malignant focal hepatic lesions.
p-values of 0.01 or less were considered for statistically significant.
Equipments
The studies were conducted on the PHILIPS INTERNA 3 TESLA MRI.
A 16 channel phased array XL-TORSO coil was used.
MRI Protocol
T2WI TSE in axial plane. mDixon [6] sequence (in phase + opposed phase + only water + only fat) axial plane.
Respiratory-triggered (with a navigator-echo technique) fat-suppressed (SPIR-selective presaturation using inversion recovery) single-shot echo-planar DW imaging was performed in the transverse plane with tridirectional diffusion gradients by using three b values (0,100, 300, 500, and 1000 sec/mm2) within the same acquisition.
All ADCs were calculated on a workstation with standard software (Diffusion Calculation, Philips Medical Systems). The signal intensities for ADC calculation were measured by using operator-defined region-of-interest (ROI).
In large lesions the mean value of 3 different ROI measurements on the same slice/adjacent slice was calculated. ROI area which was used for ADC calculation in larger lesions was approximately 30mm². For smaller lesions single ROI well centered within the lesion was used for ADC calculation.
In lesions with necrotic or fibrous core, measurement of this area was avoided. ADC of normal liver parenchyma was calculated in an area away from focal liver lesions.
Results
Between May 2012 to May 2013, 30 patients having a total liver lesion count of 147 were subjected to undergo Diffusion weighted MRI of upper abdomen. Out of the 147 focal hepatic lesions, 61 lesions were benign and 86 lesions were malignant. ADC values of these focal hepatic lesions were calculated at different “b” values and the results were tabulated (Tables 1, 2). Based on the interpretation of the data and using ROC curves, T test and ANOVA test results were obtained (Table 3).
Table 1: Mean ADC’S of different lesions at different “b” values.
|
|
Mean ADC'S (x10-3 mm2/sec)
|
|
b value
(s/mm2)
|
100
|
300
|
500
|
1000
|
|
LESION
|
|
Hemangioma
|
2.503
|
2.461
|
2.083
|
1.798
|
|
Metastases
|
1.549
|
1.291
|
1.203
|
1.118
|
|
Hepatocellular carcinoma
|
1.447
|
1.055
|
0.987
|
0.869
|
|
Abscess
|
1.616
|
1.602
|
1.479
|
1.268
|
|
Regenerative nodule
|
2.345
|
1.387
|
1.342
|
1.075
|
|
Tuberculomas
|
1.391
|
1.448
|
1.170
|
1.105
|
|
Hydatid cyst
|
2.974
|
3.155
|
2.989
|
2.678
|
|
Adenoma
|
2.715
|
1.511
|
1.295
|
0.917
|
Table 2: Mean ADC’S of benign and malignant lesions at different “b” values.
|
|
Mean ADC'S (x10-3 mm2/sec)
|
|
b value
(s/mm2)
|
100
|
300
|
500
|
1000
|
|
LESION
|
|
Benign
|
2.407
|
2.302
|
2.031
|
1.762
|
|
Malignant
|
1.538
|
1.266
|
1.180
|
1.092
|
Table 3: Diagnostic validity of ADC in differentiating benign v/s mailgnant with ADC at a particular “b” value.
|
b value
(sec/mm2)
|
Cut off value of ADC
(x10-3 mm2/sec)
|
Sensitivity
(%)
|
Specificity
(%)
|
Positive predictive value
(%)
|
Negative predictive value
(%)
|
|
300
|
1.533
|
82
|
82.5
|
77
|
86.6
|
|
500
|
1.519
|
77
|
86
|
80
|
84
|
|
1000
|
1.506
|
64
|
96.5
|
92.8
|
79
|
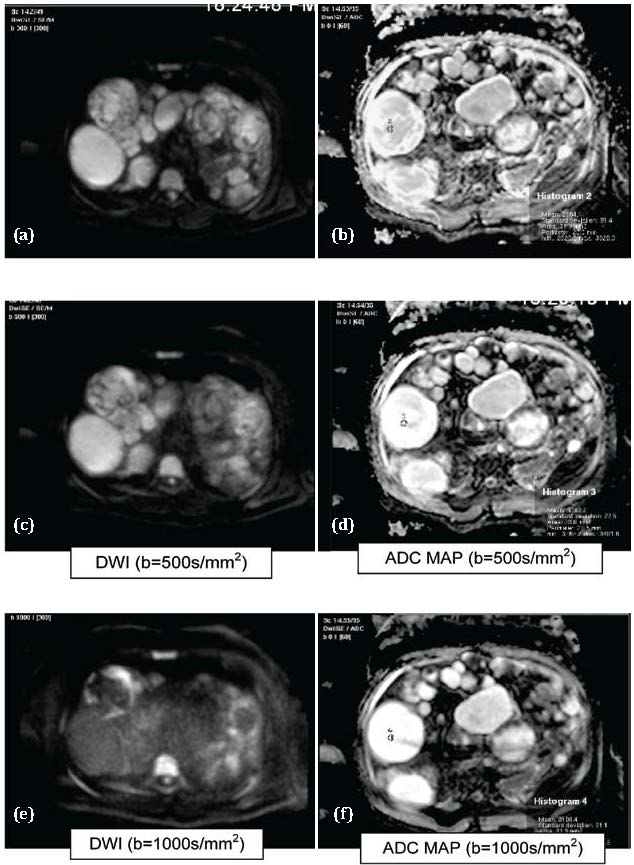
Figure 1a,b,c,d,e,f: Hydatid cysts. Abbreviations: T1= Hypointense, T2= Hyperintense, DWI: Hyperintese, ADC MAP: Hyperintense (T2 shine through effect).
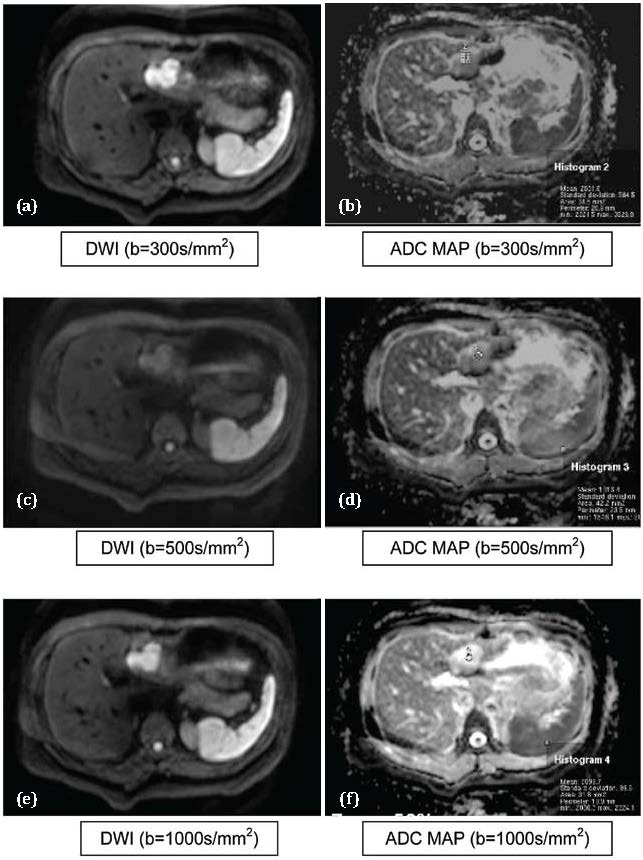
Figure 2 a,b,c,d,e,f: Hemangioma. Abbreviations: DWI: Hyperintese, ADC MAP: Hyperintense (T2 Shine through effect) (showing gradual fainting of restricted signal intensity on dwi at higher “b” values).
The mean ADC values of malignant lesions were significantly lower than those of benign lesions at all b values which were used (P<0.01).
The cut-off values of ADCs (computed by using ROC curves) used to differentiate benign from malignant focal hepatic lesions were 1.533, 1.519 and1.506 (x 10-3 mm2/sec) at b values of 300, 500 and 1000 sec/mm2 respectively. With these cut-off values it is observed that the b value which has the highest sensitivity to differentiate between benign from malignant lesion is 300 s/mm2 (Sensitivity of 82%).
The b value which has the highest specificity to differentiate between benign and malignant lesion is 1000 sec/mm2 (Specificity of 92.8%). (DWI= Diffusion Weighted Imaging) (ADC= Apparent Diffusion Coefficient). The T test value was highest (10.249) when b value of 500s/mm2 was used for computing ADCs for FLL characterization as benign or malignant.
The T test values were 9.541 and 9.073 when b values of 300 and 1000 s/mm2 were used. Mean ADC value in differentiating between HCC (Figure 3) and Metastasis (Figure 4) were not statistically significant (p>0.01). This finding is consistent with Melanie Brugel et al. [7].
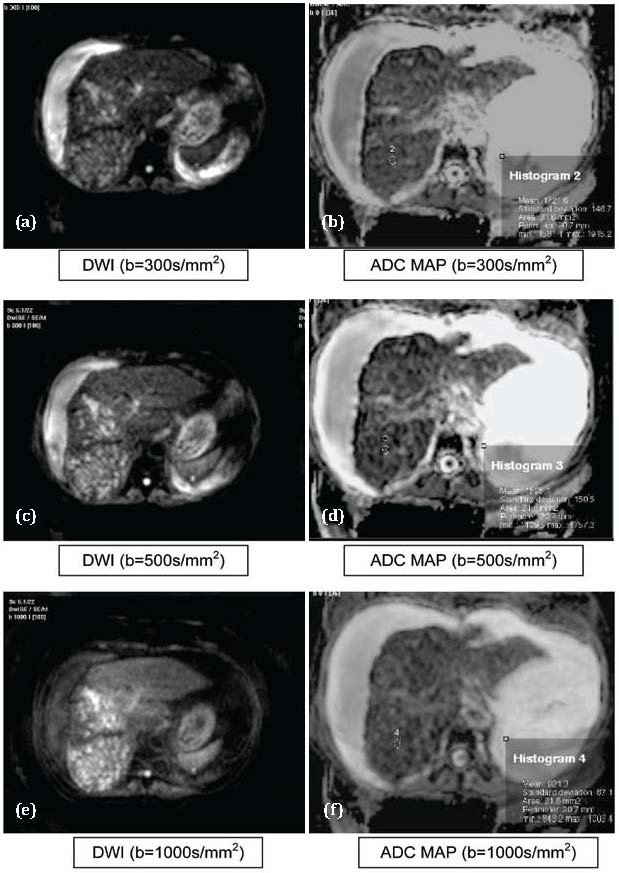
Figure 3 abcdef: Hepatocellular carcinoma. Abbreviations: T1: Hypointense, T2: Hyperintense, DWI: Hyperintese, ADC MAP: Hypointense
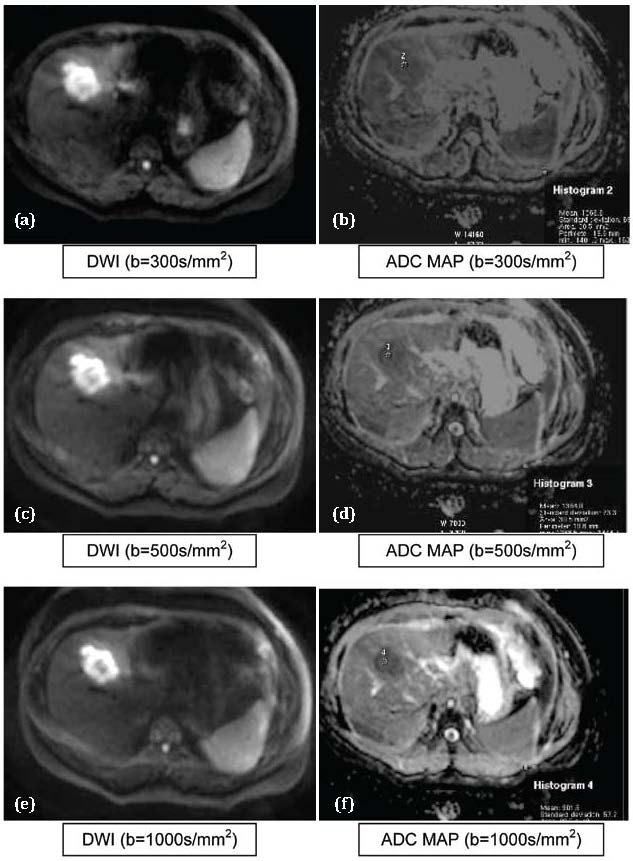
Figure 4 a,b,c,d,e,f: Metastasis. Abbreviations: DWI: Hyperintese, ADC MAP: Hypointense (Showing persistence of restricted signal intensity on DWI even at higher “b” values).
Mean ADC value in differentiating between hemangioma (Figure 2) and Metastasis (Figure 4) were statistically significant (p<0.01).This finding is consistent with Melanie Brugel et al. [7] which stated that ADCs of benign and malignant lesions do differ significantly. Similarly, statistically significant differences were noted between the mean ADCs of hemangioma and HCCs.
Benign hepatic lesions have generally higher ADC values compared with malignant lesions, with variable degree of overlap [8, 9, 10, 11]. Different ADC cutoffs (1.4–1.6 × 10⁻³ mm2/sec) have been described in the literature, with a reported sensitivity of 74%–100% and specificity of 77%–100% for diagnosing malignant lesions.
It was found that there is no significant difference between ADC values computed by performing diffusion weighted imaging (SS EPI) at 1.5T and 3T MR gradient field strengths [12]. So, the ADC values computed in our study can be compared with other studies performed on 1.5T MR scanner.
The mean ADCs of hydatid cysts (Figure 1) in our study were 3.11, 2.98 and 2.67 mm2/sec at b values of 300, 500 and 1000 sec/mm2 respectively. These results were consistent with the ADC values of type 1/2/3 hydatid cysts as per findings of Cece H et al. [13] who studied the DWI at b values of 0, 500 and 1000 sec/mm2.
The mean ADCs of abscesses (Figure 5) in our study were 1.602, 1.479 and 1.268 mm2/sec at b values of 300, 500 and 1000 sec/mm2 respectively. These results were not consistent with the ADC values which were computed by Chan J H M et al. [14] who studied the DWI at b values of 200, 600 and 1000s/mm2.
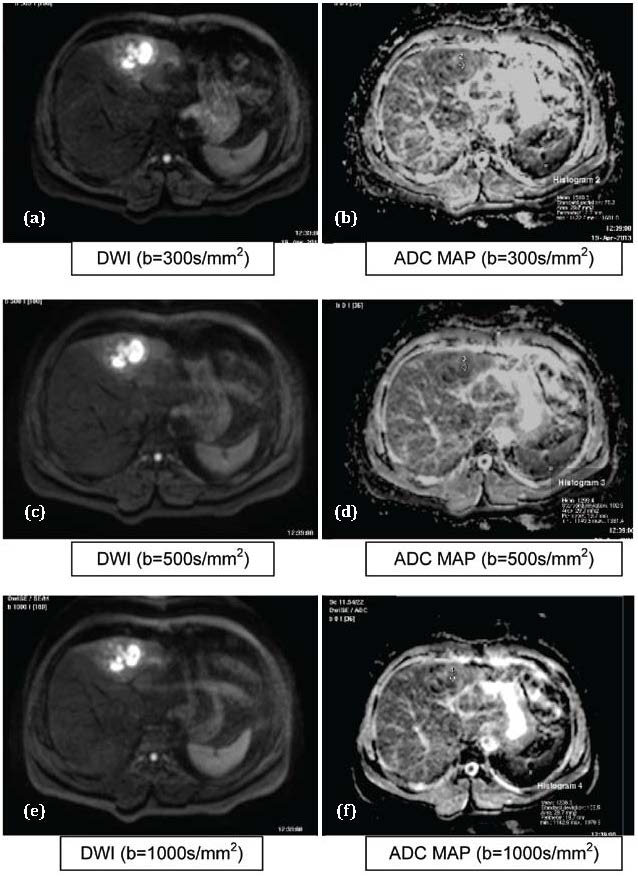
Figure 5 a,b,c,d,e,f: Abscess. Abbreviations: T1: Hypointense, T2: Hyperintense, DWI: Hyperintese, ADC MAP: Hypointense.
The mean ADCs of tuberculomas in our study were 1.448, 1.170 and 1.105 mm2/sec at b values of 300, 500 and 1000 sec/mm2 respectively. The ADC value which was computed at b value of 500 sec/mm2 was consistent with the findings of Bruegel M et al (7) who studied the DWI in 4 lesions of tuberculomas with b values of 50, 300 and 500 sec/mm2.
The mean ADCs of regenerative nodules in our study were 1.38, 1.34 and 1.07 mm2/sec at b values of 300, 500 and 1000 sec/mm2 respectively. The ADC values were not consistent with the findings of Irene Mwangi et al. [15] who studied the DWI in regenerative nodules with b values of 0 and 770 sec/mm2.
The Diffusion-weighted MRI sequence is a useful diagnostic tool with no additive use of intravenous contrast media, and it can contribute to accurate diagnosis and discrimination between benign and malignant hepatic masses.
ADCs computed by using b value of 1000s/mm2 has the highest ability (among the other b values used in the study) to discriminate and characterize different focal liver lesions. ADCs computed using “b” value of 100s/mm2 has no role in differentiating benign from malignant focal hepatic lesions.
ADCs computed by using b value of 500s/mm2 has highest ability to differentiate benign from malignant focal hepatic lesions. So, it’s the best b value among those used in the study to differentiate benign from malignant focal hepatic lesions.
ADCs computed by using b value of 300s/mm2 has highest sensitivity to differentiate benign from malignant focal hepatic lesions and those ADCs computed by using b value of 1000s/mm2 has the highest specificity serving the same purpose. So, if given an option; combination of two b values, one >100 and <500 (300s/mm2 in our study) and a higher >500 (1000s/mm2 in our study) should be used to increase sensitivity and specificity respectively and thereby increasing the diagnostic yield.
Mean ADC values of malignant lesions were significantly lower than those of benign lesions. The cut-off values of ADCs used to differentiate benign from malignant focal hepatic lesions were 1.533, 1.519 and1.506 (x 10-3 mm2/sec) at b values of 300, 500 and 1000 sec/mm2 respectively.
DWI has no role in differentiating Hepatocellular carcinoma from metastases. DWI has a role in differentiating hemangiomas from metastatic lesions. DWI has a role in differentiating hemangiomas from hepatocellular carcinomas.
Limitations: The patient population was small and the number of solid benign lesions like adenomas was also too small. With a large number of solid benign masses, which can mimic a malignant tumor as depicted on T2 weighted imaging and DWI, the detection rate of lesions might have been lower and characterization may have varied for the differentiation between malignant lesions and benign lesions. Benign hepatocellular mass lesions were first evaluated by Taouli et al. [16] and their ADC values were found to be lower than cysts and hemangiomas, and higher than malignant masses. Our study had a relatively small number of lesions with pathological confirmation. Only b values upto 1000s/mm2 were used in the study to characterize the focal liver lesions. Effect of b values >1000s/mm2 are not taken into consideration while calculating sensitivity and specificity of ADCs to characterize focal liver lesions.
Conclusion
To conclude we can say that measurements of the ADCs of focal liver lesions on the basis of a respiratory triggered DW-SS-EPI sequence may constitute a useful supplementary method for lesion characterization. Malignant lesions demonstrate significantly lower ADC values than benign lesions, but interpretation of the ADCs should be handled with care, since overlaps between some individual lesion types such as metastases and HCCs seem to be inevitable. Although still in its infancy, DWI has already proven itself to be of great value in characterization of focal hepatic lesions along with other MRI sequences particularly in those with diagnostic dilemma.With further refinement within the sequences used in hepatic MRI and inclusion of different pathological types of focal hepatic lesions above mentioned limitations will be resolved in due course of time and no doubt many other questions and limitations will arise.
Conflicts of interest
Authors declare no conflicts of interest.
References
1. Deepak G Chhabra, Rajiv C Shah, Vipul Parikh, P Jagannath. Radiofrequency ablation of liver tumors: experience with open and percutaneous approach. Indian J Gastroenterol 2006, 25:66-70
2. Park K, Park’s text book of preventive and social medicine, 21st edition. Banarsidas Bhanot, 2011. p.352, Table 1 (Source: ICMR 2004, Assessment of non-communicable diseases).
3. Park K, Park’s text book of preventive and social medicine, 21st edition. Banarsidas Bhanot, 2011. p.353, Table 2
4. World health organization. Disease and injury regional mortality estimates for 2008; Available from: http://www.who.int/healthinfo/global_burden_disease/estimates regional/en/index.html
5. Kele P, Van der Jagt, E.World J Gastroenterol. 2010 April 7, 16:1567–1576.
6. Field Strength issue 41, September 2010. Philips. Available from: http://incenter.medical.philips.com.
7. Bruegel M, Holzapfel K, Gaa J, Woertler K, Waldt S, et al. Characterization of focal liver lesions by ADC measurements using respiratory triggered diffusion- weighted singe-shot echo-planar MR imaging technique. Eur Radiol 2008, 18:477–485.
8. Taouli B, Vilgrain V, Dumont E, Daire JL, Fan B, et al. Evaluation of liver diffusion isotropy and characterization of focal hepatic lesions with two single-shot echoplanar MR imaging sequences: prospective study in 66 patients. Radiology 2003, 226:71–78.
9. Yamada I, Aung W, Himeno Y, Nakagawa T, Shibuya H. Diffusion coefficients in abdominal organs and hepatic lesions: evaluation with intravoxel incoherent motion echoplanar MR imaging. Radiology 1999, 210:617–623.
10. Fiona Hughes Cassidy, Takeshi Yokoo, Lejla Aganovic, Robert F. Hanna, Mark Bydder, et al. Fatty Liver Disease: MR Imaging Techniques for the Detection and Quantification of Liver Steatosis. Radio Graphics 2009, 29:231–260.
11. Ichikawa T, Haradome H, et al. Diffusion-weighted MR imaging with a single-shot echoplanar sequence: detection and characterization of focal hepatic lesions. AJR Am J Roentgenol 1998, 170:397–402.
12. Rosenkrantz AB, Oei M, Babb JS, Niver BE, Taouli B. Diffusion-weighted imaging of the abdomen at 3.0 Tesla: image quality and apparent diffusion coefficient reproducibility compared with 1.5 Tesla. J Magn Reson Imaging 2011, 33:128–35.
13. Cece H, Gundogan M, Karakas O, Karakas E, Boyaci F N, et al. The role of diffusion- weighted magnetic resonance imaging in the classification of hepatic hydatid cysts. European Journal of Radiology 2013, 82:90–94.
14. Chan JHM, Tsui EYK, Luk SH, Fung ASL, Yuen MK, et al. Diffusion-weighted MR imaging of the liver: distinguishing hepatic abscess from cystic or necrotic tumor. Abdom Imaging 2001, 26:161–165.
15. Mwangi I, Hanna RF, Kased N, Malek P, Shiemorteza M, et al. Apparent Diffusion Coefficient of fibrosis and regenerative nodules in the cirrhotic liver at MRI. AJR 2010, 194:1515–1522.
16. Taouli B, Vilgrain V, Dumont E, Daire JL, Fan B, et al. Evaluation of liver diffusion isotropy and characterization of focal hepatic lesions with two single-shot echoplanar MR imaging sequences: prospective study in 66 patients. Radiology 2003; 226:71–78.