Full Text
Introduction
Healthcare Associated Infections (HAIs) are one of the most common adverse events during healthcare delivery. These are major public health issue affecting morbidity, mortality and quality of life. It is a problem worldwide. At any time, up to 7 % of patients in developed and 10% in developing countries will acquire atleast one HAI [1].
It is evident that HAIs result in prolonged hospital stay, long term disability increased resistance of microorganisms to antimicrobials, additional cost on health care system, increases financial burden, for patients and their family and preventable death.
Major HAIs include, device associated infections such as Catheter Associated Urinary Tract Infection (CAUTI), Ventilator Associated Event (VAE), Central Line-Associated Bloodstream Infection (CLABSI) & Surgical Site Infection (SSI). Catheter Associated Urinary Tract Infection (CAUTI) is the most common Hospital Acquired Infection (HAI) worldwide, account for 35- 45% of all HAI’s [2, 3].
Approximately 12-16% of adult inpatients are on indwelling urinary catheter at some point of time during their hospitalization. The risk of CAUTI increases by 3-7% with each day of urinary catheterization [4]. CAUTI can lead to complications as prostatitis, epididymitis, orchitis in males and cystitis, pyelonephritis, gram negative bacteremia, endocarditis, vertebral osteomyelitis, septic arthritis, endophthalmitis and meningitis in patients. Hence, surveillance of catheterized patients for CAUTI is of importance.
Ventilator-Association Pneumonia/Event (VAP/VAE): Healthcare associated Pneumonia (HAP) is the second most common nosocomial infection and accounts for 15-20% of total HAI’s. It is the most common cause of death among HAIs with a mortality rate up to 40% and is the primary cause of death in ICU. Ventilator associated pneumonia (VAP) for patient under mechanical ventilation, is the single most important cause of HAP. Hence, surveillance for VAP is of great importance [5].
Surveillance for VAP has been a challenge due to lack of objective and reliable definitions. To overcome it, in 2013, National Healthcare Safety Network (NHSN) introduced more objective surveillance criteria known as Ventilator Association Event (VAE) in adult location & 2019 in pediatric location [5, 6].
Mechanical ventilation is an essential, life-saving therapy for patients with critical illness and respiratory failure. These patients are at high risk for complication and poor outcomes, including death. The complications include VAP, sepsis, acute respiratory distress syndrome (ARDS), pulmonary embolism, barotrauma and pulmonary oedema. Mortality in patients with acute lung injury on mechanical ventilation is high [7].
Central Line-Associated Bloodstream Infection (CLABSI) is a major cause of mortality and morbidity. Patients in ICU settings are at higher risk of developing CLABSI as majority of them require long term central line. It can be prevented through proper insertion techniques and management of central line. Surveillance is done in any inpatient location where denominator data can be collected which can include critical care units. CLABSI surveillance after patient discharge from facility in not required [8].
Surgical Site Infection (SSI) is the costliest HAI type [9]. It is associated with an increase in hospital stay by 7-11 days and has 2-11 times higher risk of death as compared to operated patients without SSI [10]. Hence SSI surveillance is of chief importance. Surveillance of SSI with feedback of appropriate data to surgeon has been shown to be an important component of strategies to reduce SSI risk. Surveillance of surgical patients will occur in inpatient facility and outpatient department.
Quality Indicators are standardized, evidence-based measures of health care quality that can be used with readily available hospital inpatient administrative data to measure and track clinical performance and outcomes. They are the backbone on which quality assurance program of hospital relies. Calculation of several quality indicators can be used for monitoring the quality of care provided by healthcare system [11].
Quality Indicators are monitored by making use of surveillance tool (active & passive surveillance following latest Centers for Disease Control and Prevention (CDC), National Healthcare Safety Network (NHSN) guidelines). In the present study, quality indicators for device associated (CAUTI, VAE & CLABSI) & SSI infections are monitored for a period of 5 years.
The healthcare facilities are collecting standardized data on HAIs, which are used to track internal performance as well as to compare local data to national & international benchmark. However, bench mark for quality indicators of HAIs from a single hospital in Indian setting is not available.
In the present study, an attempt is made to understand the pattern of HAIs by analyzing statistical tool of quality indicators (5 years) and to establish a bench mark for HAIs in a single hospital. This information may further help to formulate policies to prevent and control HAIs at institutional levels in India. The available International benchmarks CDC & the International Nosocomial Infection Control Consortium (INICC) and two multi -centric pooled HAI data [12] from India are used as guidance.
Material and methods
A prospective observational study was conducted for 5 years from January 2016 to December 2020 at Krishna Institute of Medical Sciences, Secunderabad. It is a multi, super-specialty hospital having solid organ transplant & bone marrow transplant facilities with bed strength of 850. There are 11 ICUs with 163 beds, 22 operation theater with HEPA filters & 2 dialysis units with 71 beds. This hospital is accredited by National Accreditation Board for Hospitals and Healthcare Providers (NABH) and National Accreditation Board for Testing and Calibration Laboratories (NABL). It has Green Operation Theatre Certification.
The primary objective of this study was to analyze 5 years quality indicators of HAIs in order to find out the trends of HAI and to establish the benchmark for our institution. Hospitalized patients of all age groups, who have devices or undergone surgeries are included in the study. Hospitalized patients who do not have devices or undergone surgeries are excluded from the study.
The hospital has a multi-disciplinary infection control committee. The committee prepares policies which aims at preventing and reducing risk of HAIs in patients. The Infection Control Team (ICT) helps the committee for smooth implementation of HIC policies. The ICT comprising of Infection Control Officer (ICO), Microbiologist, designated and qualified infection control nurses (ICNs) and unit in charges of medical & surgical ICUs, pediatric & neonatal ICUs, medical & surgical wards, transplant units, emergency department, dialysis unit, OT, CSSD and housekeeping,
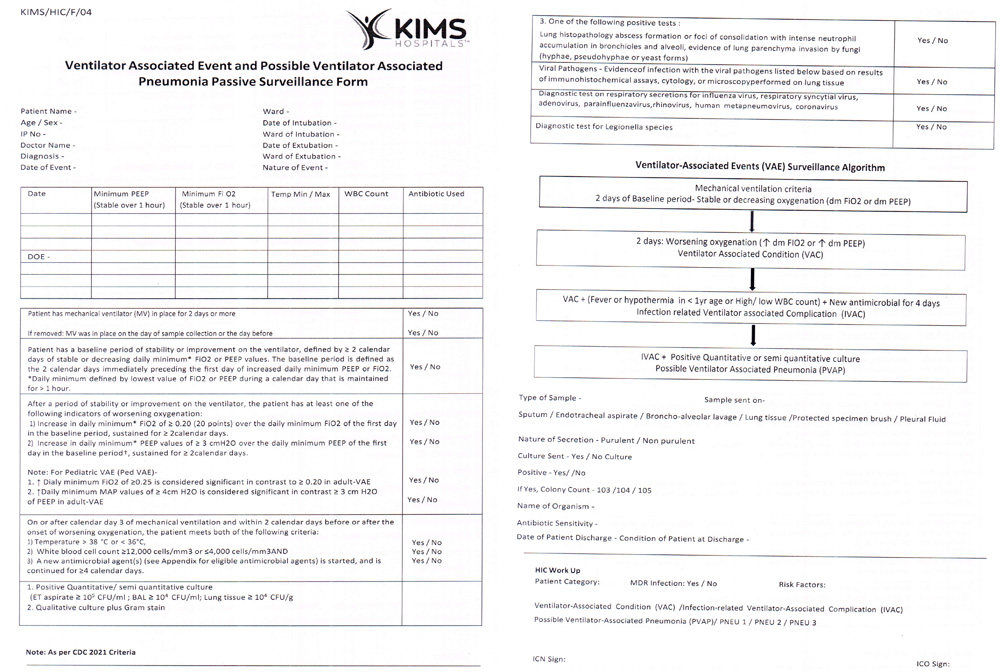
The Microbiologist & ICN’s conduct laboratory-based ward liaison surveillance. The ICN’s prospectively monitor cases while conducting rounds in ICU’s & wards and collect data for active surveillance (Supplemental Figure 1). The details of culture positive samples are collected by Microbiologist from the laboratory for passive surveillance. Data collection is done on a daily basis. The surveillance forms (active & passive) capture details of individual patients. The data collection forms are prepared and updated as per CDC, NHSN guidelines (Supplemental Figure 2-CAUTI, Supplemental Figure 3-VAE, Supplemental Figure 4-CLABSI, & Supplemental Figure 5-SSI).
Active and Passive surveillance forms are verified and analyzed by the ICO or Microbiologist routinely. The infection risks, rates & trends of device associated HAI’s (CAUTI, VAE, CLABSI) & surgical site infections (SSI) are analyzed. Appropriate feedback regarding HAI rates is provided on a regular basis to clinical consultants & incharge nursing staff in a monthly HIC meeting. The committee takes decision to implement policies which can reduce the risk of HAIs in patients.
The details of surveillance CAUTI, VAE, CLABSI & SSI are given as follows.
CAUTI
Definition: Cather -associated UTI (CAUTI) is a UTI where an indwelling urinary catheter was in place for >2 calendar days on the date of event, with day of device placement being Day 1, AND An indwelling urinary catheter was in place on the date of event or the day before. According to Centers for Disease Control and Prevention (NHSN) Surveillance Criteria for CAUTI includes [13].
(1) Catheter criteria: Patient had an indwelling urinary catheter that had been in place for more than two consecutive days in an inpatient location on the date of event AND was either present for any portion of the calendar days on the date of event or removed the day before the date of event. (2) Symptom criteria: Patient has atleast on of the following signs or symptoms. Fever (>38°C), suprapubic tenderness, costovertebral angle pain or tenderness, urinary urgency, urinary frequency, dysuria, (3) Urine culture criteria: 1 or 2 organisms isolated from urine with atleast one organism of >105 CFU/ml.
The CAUTI rate can be calculated as per the formula mentioned in Table 1. Formulae of calculation of various HAI infection rates.
Table 1: Formulae for calculation of various HAI infection rates.
|
Measures
|
Formula
|
|
CAUTI rate
|
Number of CAUTI cases/ Number of urinary catheter days x 1000
|
|
CLABSI rate
|
Number of CLABSI cases/ Number of central line days x 1000
|
|
VAE rate
|
Number of VAE cases/ Number of mechanical ventilation days x 1000
|
|
SSI rate
|
Number of SSI cases/ Number of surgeries done x 100
|
Ventilator -Association Event (VAE)
Mechanical ventilation is an essential, life-saving therapy for patients with critical illness and respiratory failure. Surveillance of patients under ventilation was limited to ventilator-associated Pneumonia (VAP) prior to 2013.
The VAE surveillance definition algorithm developed by the Working Group and implemented in the NHSN in January 2013 is based on objective, streamlined, and potentially automatable criteria that identity a broad range of conditions and complications occurring in mechanically ventilated adult patients.
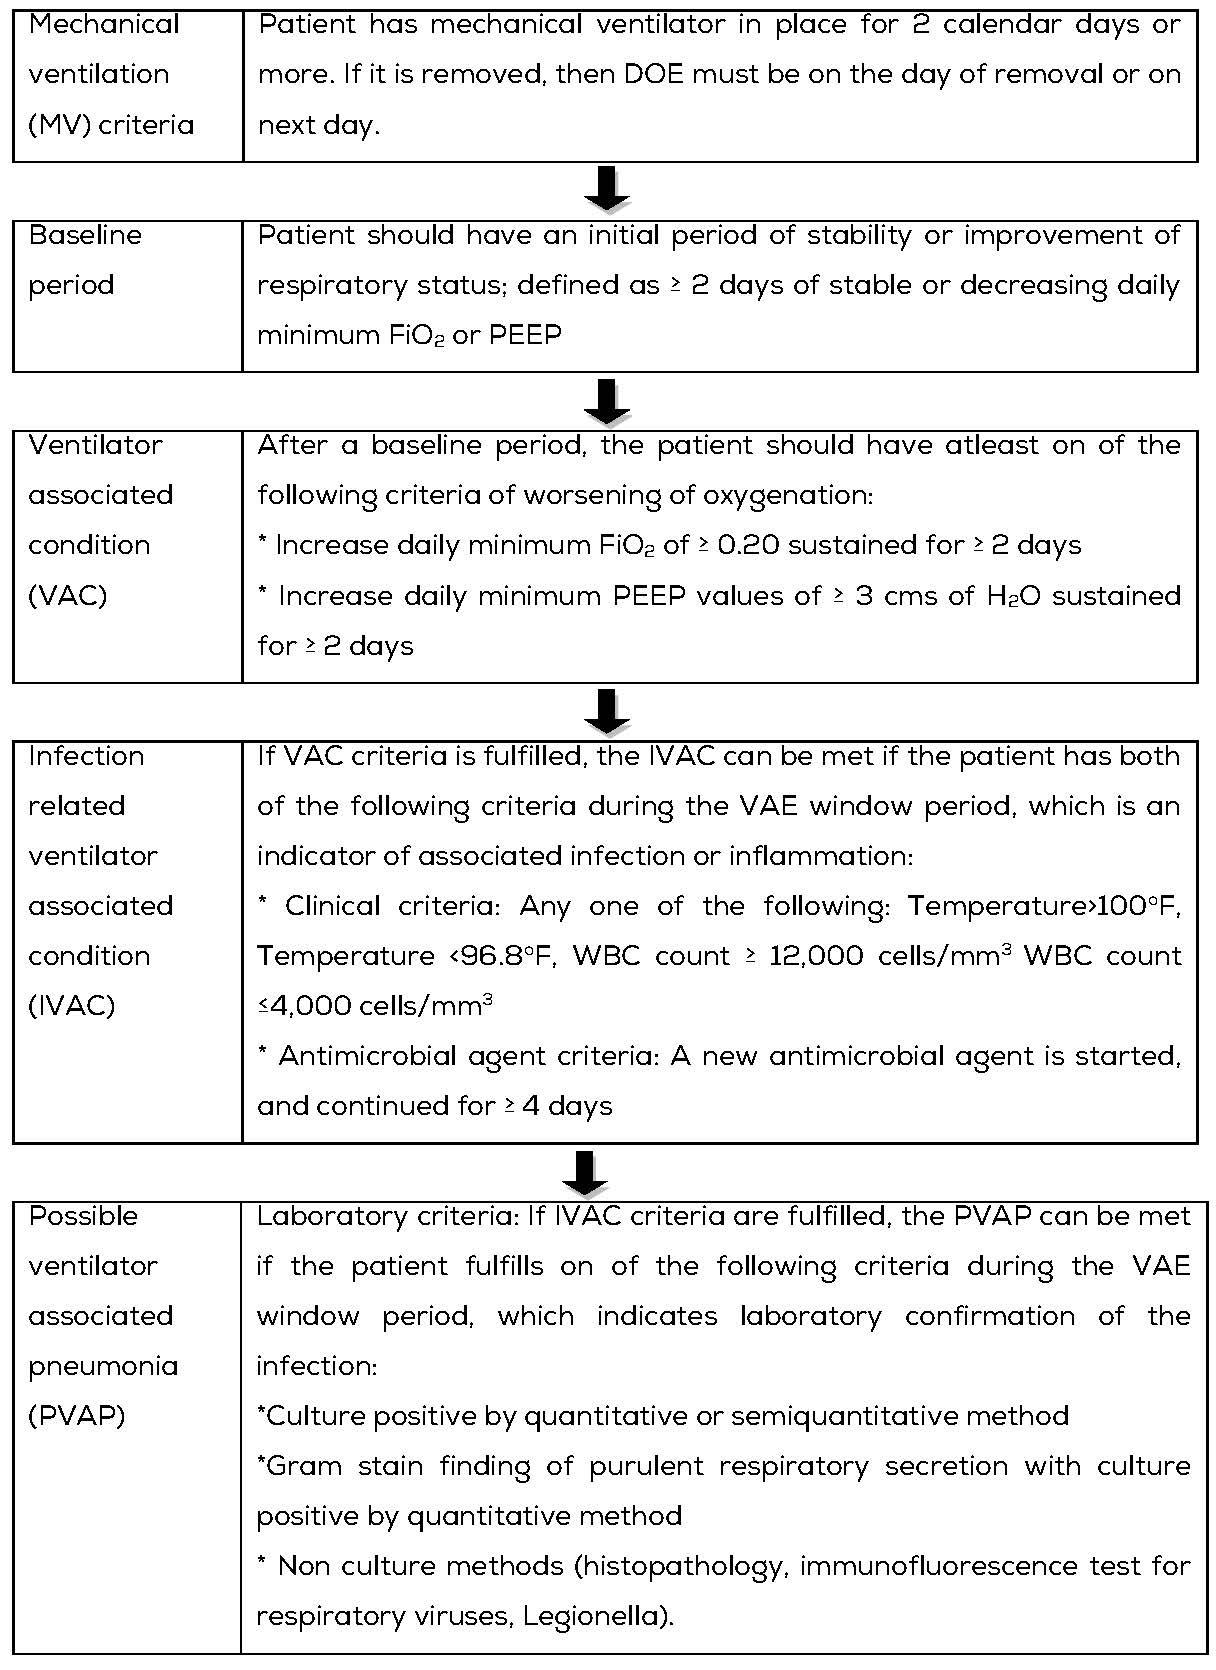
There are three tiers definition within the VAE algorithm (Table 2). This algorithm is for use in surveillance, it is not a clinical definition algorithm and is not intended for use in clinical management of patients.
Definition: VAE’s are identified by using a combination of objective criteria: deterioration in respiratory status after a period of stability or improvement on the ventilator, evidence of infection or inflammation, and laboratory evidence of respiratory infection [7].
Table 2: VAE algorithm.
VAE rates to be calculated as per the formula mentioned in Table 1, Formulae of calculation of various HAI infection rates.
Central Line-Associated Bloodstream Infection (CLABSI)
It is a major cause of mortality and morbidity. Patients in ICU settings are at higher risk of developing CLABSI as majority of them require long term central line.
Central line (CL)
An intravascular catheter that terminate at or close to the heart, or in one of the great vessels that is used for infusion, withdrawal of blood, or hemodynamic monitoring. Aorta, pulmonary artery, superior vena cava, inferior vena cava, brachiocephalic veins, internal jugular veins, subclavian veins, external iliac veins, common iliac veins, femoral veins and in neonates’ umbilical artery/vein.
Surveillance for Central Line-Associated Bloodstream Infection (CLABSI) is carried out from the day of insertion of central line till the next day of central line removal. To establish CLABSI the following criteria to be fulfilled [8]. (1) Central line criteria: Central line is in place for >2 calendar days (day of device placement = day 1). If it is removed, then DOE must be on the day of removal or on the next day, and (2) Laboratory confirmed bloodstream infection: Any one of three laboratory confirmed bloodstream infections (LCBIs).
Laboratory Confirmed Bloodstream Infection (LCBI)
Laboratory confirmed bloodstream infection (LCBI) is a primary blood stream infection that is confirmed by a positive blood culture, and the organism isolated is not attributed to any other body site. Depending up on the organism isolated (pathogen or commensal) and presence or absence of associated symptoms, LCBI can be classified into three types (Table 3).
Table 3: Types of Laboratory Confirmed Bloodstream Infection (LCBI).
|
Category
|
Age of the patient
|
Blood culture criteria
|
Symptom criteria (any 1 must be present)
|
|
Organism isolated
|
Number of samples
|
|
LCB-1
|
Any age
|
Pathogen
|
1 or more
|
Regardless of symptoms
|
|
LCB-2
|
Any age
|
Commensal
|
2 or more
|
Fever (>38°C), chills, hypotension
|
|
LCB-3
|
≤ 1 year
|
Commensal
|
2 or more
|
Fever (>38°C), hypothermia
(<36°C), apnea, bradycardia
|
In immunocompromised and neutropenic patients, mucosal barrier injury laboratory- confirmed blood stream infection (MBI-LCBI) surveillance criteria is followed (Table 4). When an LCBI criterion is met, MBI-LCBI is considered if:
- Organism isolated in blood is intestinal organism (for MBI-LCBI-1) or viridians streptococci or Rothia species (for MBI-LCBI-2 and MBI-LCBI-3)
- Patient must have one of the following- (1) Allogeneic hematopoietic stem cell transplant recipient having gastrointestinal graft versus host disease or diarrhea, (2) Neutropenia.
Table 4: Types of mucosal barrier injury laboratory- confirmed blood stream infection (MBI-LCBI).
|
MBI-LCBI 1
|
MBI-LCBI 2
|
MBI-LCBI 3
|
|
Patient of any age fully meets LCBI 1 criteria
|
Patient of any age fully meets LCBI 2 criteria
|
Patient <1 year of age fully meets LCBI 3 criteria
|
|
With atleast one blood specimen
|
With atleast two matching blood specimens
|
|
Identified by culture or non-culture based microbiology testing method
|
|
With only intestinal organisms
|
With only viridans group Streptococci and / or Rothia spp & but no other organisms
|
CLABSI rates to be calculated as per the formula mentioned in Table 1, Formulae of calculation of various HAI infection rates.
Surgical Site Infection (SSI)
It is one of the most common HAI and accounts for significant morbidity and mortality, accounting for longer stay in hospital and a higher risk of death as compared to operated patients without SSI. Hence SSI surveillance is of chief importance.
Definition: Surgical site infections are defined as infections that develop at the surgical site within 30 days of surgery (or within 90 days for some surgeries such as breast, cardiac, and joint surgeries including implants) [14].
Advances made in infection control practices, improved operating room ventilation, sterilization methods, barriers, surgical technique and antimicrobial prophylaxis.
Surveillance of SSI with feedback of appropriate data to surgeons has been shown to be an important component of strategies to reduce SSI rate. Surveillance of surgical patients will occur in any inpatient facility and/ or hospital outpatient procedure department where the selected NHSN operative procedures are performed. Surveillance method include active, patient based, prospective surveillance. Both ante-discharge and post-discharge surveillance should be conducted.
SSI rate to be calculated as per the formula mentioned in Table 1, Formulae of calculation of various HAI infection rates.
Results
We conducted a detailed analysis of Quality indicators (QI) of HAIs in our hospital between January 2016 and December 2020. The details of total number of HAI cases and total number of device days were analyzed (Tables 5, 6, 7&8).
The table 5 shows details of number of CAUTI cases, number of urinary catheter days and CAUTI rate which was calculated as per the formula mentioned in table 1 as per the CDC/NHSN guidelines, CAUTI rate was found to be 1.03 in 2016, 0.24 in 2017, 0.25 in 2018, 0.27 in 2019 and 0.47 in 2020.
The table 6 shows details of number of VAE cases, number of mechanical ventilation days and VAE rate which was calculated as per the formula mentioned in table 1 as per the CDC/NHSN guidelines, VAE rate was found to be 5.33 in 2016, 2.10 in 2017, 2.13 in 2018, 1.18 in 2019 & 1.10 in 2020.
The table 7 shows details of number of CLABSI cases, number of central line days and CLABSI rate which was calculated as per the formula mentioned in table 1 as per the CDC/NHSN guidelines, CLABSI rate was found to be 1.58 in 2016, 0.97 in 2017, 1.22 in 2018, 1.12 in 2019 & 1.88 in 2020.
The table 8 shows details of number of SSI cases, number of surgeries done and SSI rate which was calculated as per the formula mentioned in table 1 as per the CDC/NHSN guidelines, it was found to be 0.29 in 2016, 0.18 in 2017, 0.18 in 2018, 0.12 in 2019 and 0.32 in 2020.
Table 5: Details of number of CAUTI cases, urinary catheter days and CAUTI rate- 2016-2020.
|
MONTH
|
CAUTI
|
2016
|
2017
|
2018
|
2019
|
2020
|
|
|
January
|
Number of CAUTI cases
|
3
|
2
|
1
|
0
|
3
|
|
|
No. of urinary catheter days
|
3431
|
3956
|
4257
|
5079
|
4137
|
|
|
CAUTI rate
|
0.8
|
0.5
|
0.23
|
0
|
0.72
|
|
|
February
|
Number of CAUTI cases
|
7
|
0
|
0
|
0
|
1
|
|
|
No. of urinary catheter days
|
3878
|
3795
|
4082
|
3812
|
4061
|
|
|
CAUTI rate
|
1.80
|
0
|
0
|
0
|
0.24
|
|
|
March
|
Number of CAUTI cases
|
11
|
3
|
0
|
2
|
3
|
|
|
No. of urinary catheter days
|
3839
|
4018
|
4076
|
3914
|
4376
|
|
|
CAUTI rate
|
2.86
|
0.74
|
0
|
0.51
|
0.68
|
|
|
April
|
Number of CAUTI cases
|
3
|
0
|
1
|
0
|
0
|
|
|
No. of urinary catheter days
|
4097
|
4186
|
3754
|
3612
|
1808
|
|
|
CAUTI rate
|
0.73
|
0
|
0.26
|
0
|
0
|
|
|
May
|
Number of CAUTI cases
|
3
|
1
|
1
|
1
|
1
|
|
|
No. of urinary catheter days
|
4154
|
4482
|
4117
|
4326
|
2306
|
|
|
CAUTI rate
|
0.72
|
0.22
|
0.24
|
0.23
|
0.43
|
|
|
June
|
Number of CAUTI cases
|
6
|
1
|
3
|
2
|
0
|
|
|
No. of urinary catheter days
|
4422
|
3785
|
5918
|
4309
|
279
|
|
|
CAUTI rate
|
1.35
|
0.26
|
0.5
|
0.46
|
0
|
|
|
July
|
Number of CAUTI cases
|
9
|
0
|
2
|
1
|
1
|
|
|
No. of urinary catheter days
|
4468
|
3634
|
3694
|
3939
|
1576
|
|
|
CAUTI rate
|
2.01
|
0
|
0.54
|
0.25
|
0.63
|
|
|
August
|
Number of CAUTI cases
|
2
|
0
|
3
|
2
|
0
|
|
|
No. of urinary catheter days
|
4754
|
3881
|
4338
|
4379
|
2121
|
|
|
CAUTI rate
|
0.42
|
0
|
0.69
|
0.45
|
0
|
|
|
September
|
Number of CAUTI cases
|
2
|
0
|
0
|
4
|
2
|
|
|
No. of urinary catheter days
|
4352
|
4526
|
4232
|
4042
|
2930
|
|
|
CAUTI rate
|
0.45
|
0
|
0
|
0.98
|
0.68
|
|
|
October
|
Number of CAUTI cases
|
2
|
1
|
1
|
1
|
1
|
|
|
No. of urinary catheter days
|
4193
|
4255
|
4238
|
4454
|
2887
|
|
|
CAUTI rate
|
0.47
|
0.23
|
0.23
|
0.22
|
0.34
|
|
|
November
|
Number of CAUTI cases
|
3
|
2
|
0
|
1
|
2
|
|
|
No. of urinary catheter days
|
4108
|
4214
|
4766
|
4343
|
3295
|
|
|
CAUTI rate
|
0.73
|
0.47
|
0
|
0.23
|
0.6
|
|
|
December
|
Number of CAUTI cases
|
0
|
2
|
1
|
0
|
2
|
|
|
No. of urinary catheter days
|
3692
|
4416
|
4246
|
4561
|
3829
|
|
|
CAUTI rate
|
0
|
0.45
|
0.23
|
0
|
0.52
|
|
|
Total
|
Number of CAUTI cases
|
51
|
12
|
13
|
14
|
16
|
|
|
No. of urinary catheter days
|
49,388
|
49,148
|
51,718
|
50,770
|
33,605
|
|
|
CAUTI rate
|
1.03
|
0.24
|
0.25
|
0.27
|
0.47
|
|
Table 6: Details of number of VAE cases, mechanical ventilation days and VAE rate-2016-2020.
|
MONTH
|
VAE
|
2016
|
2017
|
2018
|
2019
|
2020
|
|
|
January
|
Number of VAE Cases
|
4
|
2
|
1
|
0
|
2
|
|
|
No. of mech ventilation days
|
700
|
968
|
911
|
885
|
912
|
|
|
VAE rate
|
5.71
|
2.06
|
1.09
|
0
|
2.19
|
|
|
February
|
Number of VAE Cases
|
5
|
3
|
3
|
0
|
3
|
|
|
No. of mech ventilation days
|
791
|
823
|
981
|
825
|
772
|
|
|
VAE rate
|
6.32
|
3.64
|
3.05
|
0
|
3.88
|
|
|
March
|
Number of VAE Cases
|
4
|
2
|
2
|
1
|
1
|
|
|
No. of mech ventilation days
|
696
|
877
|
775
|
777
|
573
|
|
|
VAE rate
|
5.74
|
2.28
|
2.58
|
1.28
|
1.74
|
|
|
April
|
Number of VAE Cases
|
5
|
3
|
3
|
1
|
0
|
|
|
No. of mech ventilation days
|
788
|
888
|
722
|
825
|
431
|
|
|
VAE rate
|
6.34
|
3.37
|
4.15
|
1.21
|
0
|
|
|
May
|
Number of VAE Cases
|
2
|
5
|
3
|
0
|
1
|
|
|
No. of mech ventilation days
|
625
|
1109
|
866
|
797
|
596
|
|
|
VAE rate
|
3.20
|
4.50
|
3.4
|
0
|
1.67
|
|
|
June
|
Number of VAE Cases
|
2
|
4
|
3
|
0
|
0
|
|
|
No. of mech ventilation days
|
758
|
734
|
759
|
828
|
915
|
|
|
VAE rate
|
2.63
|
5.44
|
3.95
|
0
|
0
|
|
|
July
|
Number of VAE Cases
|
6
|
0
|
2
|
1
|
1
|
|
|
No. of mech ventilation days
|
817
|
716
|
624
|
664
|
558
|
|
|
VAE rate
|
7.34
|
0
|
3.20
|
1.5
|
1.79
|
|
|
August
|
Number of VAE Cases
|
12
|
2
|
3
|
1
|
0
|
|
|
No. of mech ventilation days
|
989
|
905
|
749
|
863
|
1510
|
|
|
VAE rate
|
12.1
|
2.20
|
4.0
|
1.15
|
0
|
|
|
September
|
Number of VAE Cases
|
5
|
0
|
1
|
1
|
0
|
|
|
No. of mech ventilation days
|
886
|
1155
|
808
|
932
|
924
|
|
|
VAE rate
|
5.64
|
0
|
1.23
|
1.07
|
0
|
|
|
October
|
Number of VAE Cases
|
3
|
1
|
1
|
2
|
0
|
|
|
No. of mech ventilation days
|
949
|
1072
|
1140
|
892
|
764
|
|
|
VAE rate
|
3.16
|
0.93
|
0.87
|
2.24
|
0
|
|
|
November
|
Number of VAE Cases
|
3
|
3
|
0
|
3
|
1
|
|
|
No. of mech ventilation days
|
1062
|
1218
|
995
|
947
|
893
|
|
|
VAE rate
|
2.82
|
2.46
|
0
|
3.16
|
1.11
|
|
|
December
|
Number of VAE Cases
|
4
|
0
|
0
|
2
|
2
|
|
|
No. of mech ventilation days
|
868
|
1062
|
987
|
906
|
781
|
|
|
VAE rate
|
4.60
|
0
|
0
|
2.20
|
2.56
|
|
|
Total
|
Number of VAE Cases
|
55
|
25
|
22
|
12
|
11
|
|
|
No. of mech ventilation days
|
9,929
|
11,527
|
10,317
|
10,141
|
9,629
|
|
|
VAE rate
|
5.53
|
2.1
|
2.13
|
1.18
|
1.1
|
|
Table 7: Details of number of CLABSI cases, central line days & CLABSI rate -2016-2020.
|
MONTH
|
CLABSI
|
2016
|
2017
|
2018
|
2019
|
2020
|
|
|
January
|
Number of CLABSI cases
|
3
|
2
|
1
|
2
|
0
|
|
|
Number of central line days
|
1323
|
1047
|
933
|
953
|
949
|
|
|
CLABSI rate
|
2.26
|
1.91
|
1.07
|
2.09
|
0
|
|
|
February
|
Number of CLABSI cases
|
3
|
0
|
2
|
1
|
2
|
|
|
Number of central line days
|
1306
|
1095
|
901
|
950
|
867
|
|
|
CLABSI rate
|
2.29
|
0
|
2.21
|
1.05
|
2.30
|
|
|
March
|
Number of CLABSI cases
|
4
|
0
|
1
|
0
|
4
|
|
|
Number of central line days
|
1237
|
1328
|
1065
|
987
|
887
|
|
|
CLABSI rate
|
3.23
|
0
|
0.93
|
0
|
4.5
|
|
|
April
|
Number of CLABSI cases
|
2
|
2
|
1
|
4
|
0
|
|
|
Number of central line days
|
1314
|
1146
|
911
|
872
|
275
|
|
|
CLABSI rate
|
1.52
|
1.74
|
1.09
|
4.58
|
0
|
|
|
May
|
Number of CLABSI cases
|
1
|
2
|
1
|
1
|
0
|
|
|
Number of central line days
|
1066
|
1210
|
872
|
772
|
679
|
|
|
CLABSI rate
|
0.93
|
1.65
|
1.14
|
1.29
|
0
|
|
|
June
|
Number of CLABSI cases
|
3
|
1
|
3
|
0
|
0
|
|
|
Number of central line days
|
1093
|
883
|
872
|
819
|
875
|
|
|
CLABSI rate
|
2.74
|
1.13
|
3.44
|
0
|
0
|
|
|
July
|
Number of CLABSI cases
|
2
|
2
|
0
|
1
|
1
|
|
|
Number of central line days
|
1295
|
1100
|
717
|
818
|
519
|
|
|
CLABSI rate
|
1.54
|
1.81
|
0
|
1.2
|
1.92
|
|
|
August
|
Number of CLABSI cases
|
2
|
0
|
2
|
1
|
1
|
|
|
Number of central line days
|
1117
|
1116
|
843
|
927
|
603
|
|
|
CLABSI rate
|
1.79
|
0
|
2.37
|
1.07
|
1.65
|
|
|
September
|
Number of CLABSI cases
|
1
|
1
|
1
|
0
|
1
|
|
|
Number of central line days
|
1175
|
1189
|
822
|
820
|
820
|
|
|
CLABSI rate
|
0.85%
|
0.84
|
1.21
|
0
|
1.21
|
|
|
October
|
Number of CLABSI cases
|
2
|
1
|
0
|
1
|
3
|
|
|
Number of central line days
|
1120
|
1040
|
933
|
822
|
1064
|
|
|
CLABSI rate
|
1.78
|
0.96
|
0
|
1.21
|
2.81
|
|
|
November
|
Number of CLABSI cases
|
0
|
1
|
1
|
1
|
3
|
|
|
Number of central line days
|
1348
|
1058
|
933
|
964
|
1163
|
|
|
CLABSI rate
|
0
|
0.94
|
1.07
|
1.03
|
2.57
|
|
|
December
|
Number of CLABSI cases
|
0
|
1
|
0
|
0
|
4
|
|
|
Number of central line days
|
1142
|
1110
|
852
|
916
|
1359
|
|
|
CLABSI rate
|
0
|
0.90
|
0
|
0
|
2.94
|
|
|
Total
|
Number of CLABSI cases
|
23
|
13
|
13
|
12
|
19
|
|
|
Number of central line days
|
14,536
|
13,327
|
10,654
|
10,620
|
10,060
|
|
|
CLABSI rate
|
1.58
|
0.97
|
1.22
|
1.12
|
1.88
|
|
Table 8: Details of number of SSI cases, number of surgeries done & SSI rate- 2016-2020.
|
Month
|
Surgical site infections
|
2016
|
2017
|
2018
|
2019
|
2020
|
|
|
January
|
Number of SSI cases
|
4
|
1
|
1
|
0
|
4
|
|
|
Number of surgeries done
|
1126
|
1107
|
1134
|
1206
|
1303
|
|
|
SSI rate
|
0.35%
|
0.09%
|
0.08%
|
0
|
0.30%
|
|
|
February
|
Number of SSI cases
|
5
|
1
|
1
|
0
|
5
|
|
|
Number of surgeries done
|
1126
|
1158
|
1161
|
1190
|
1220
|
|
|
SSI rate
|
0.44%
|
0.08%
|
0.08%
|
0
|
0.40%
|
|
|
March
|
Number of SSI cases
|
4
|
1
|
1
|
2
|
3
|
|
|
Number of surgeries done
|
1390
|
1319
|
1305
|
1240
|
928
|
|
|
SSI rate
|
0.28%
|
0.07%
|
0.07%
|
0.16%
|
0.32%
|
|
|
April
|
Number of SSI cases
|
2
|
4
|
3
|
3
|
2
|
|
|
Number of surgeries done
|
1391
|
1299
|
1145
|
1260
|
322
|
|
|
SSI rate
|
0.14%
|
0.30%
|
0.26%
|
0.23%
|
0.62%
|
|
|
May
|
Number of SSI cases
|
4
|
5
|
2
|
1
|
0
|
|
|
Number of surgeries done
|
1403
|
1402
|
1425
|
1435
|
667
|
|
|
SSI rate
|
0.28%
|
0.35%
|
0.14%
|
0.06%
|
0
|
|
|
June
|
Number of SSI cases
|
4
|
3
|
3
|
2
|
1
|
|
|
Number of surgeries done
|
342
|
1282
|
1320
|
1392
|
736
|
|
|
SSI rate
|
1.16%
|
0.23%
|
0.22%
|
0.14%
|
0.13%
|
|
|
July
|
Number of SSI cases
|
4
|
3
|
3
|
1
|
2
|
|
|
Number of surgeries done
|
1372
|
1196
|
1374
|
1538
|
487
|
|
|
SSI rate
|
0.29%
|
0.25%
|
0.21%
|
0.06%
|
0.41%
|
|
|
August
|
Number of SSI cases
|
6
|
2
|
3
|
2
|
2
|
|
|
Number of surgeries done
|
1263
|
1217
|
1310
|
1323
|
455
|
|
|
SSI rate
|
0.47%
|
0.16%
|
0.22%
|
0.15%
|
0.43%
|
|
|
September
|
Number of SSI cases
|
6
|
3
|
3
|
1
|
0
|
|
|
Number of surgeries done
|
1163
|
1250
|
1221
|
1267
|
796
|
|
|
SSI rate
|
0.51%
|
0.24%
|
0.24%
|
0.07%
|
0
|
|
|
October
|
Number of SSI cases
|
1
|
1
|
1
|
0
|
6
|
|
|
Number of surgeries doe
|
1184
|
1148
|
1276
|
1263
|
922
|
|
|
SSI rate
|
0.08%
|
0.08%
|
0.07%
|
0
|
0.65%
|
|
|
November
|
Number of SSI cases
|
1
|
2
|
3
|
2
|
3
|
|
|
Number of surgeries done
|
1196
|
1304
|
1295
|
1263
|
1015
|
|
|
SSI rate
|
0.08%
|
0.15%
|
0.23%
|
0.15%
|
0.29%
|
|
|
December
|
Number of SSI cases
|
1
|
2
|
4
|
5
|
4
|
|
|
Number of surgeries done
|
1168
|
1245
|
1037
|
1255
|
1145
|
|
|
SSI rate
|
0.08%
|
0.16%
|
0.38%
|
0.39%
|
0.34%
|
|
|
Total
|
Number of SSI cases
|
42
|
28
|
28
|
19
|
32
|
|
|
Number of surgeries done
|
14,124
|
14,927
|
15,003
|
15,632
|
9,996
|
|
|
SSI rate
|
0.29
|
0.18
|
0.18
|
0.12
|
0.32
|
|
We further analyzed the cumulative data of 5 years for each HAI following the formulae proposed by CDC/NHSN guidelines. Data revealed, HAI rates were highest for VAE (2.42/ 1000 ventilator days), the next was CLABSI (1.35/ 1000 central line days), followed by CAUTI (0.45/1000 urinary catheter days). SSI rate was (0.21/ 100 surgeries) as shown in Table 9.
Prior to this study in 2016, we standardized our institutional benchmarks as 2 for CAUTI, 5.5 for VAE and 3 for CLABSI by considering CDC/ NHSN, INICC and multicentric pooled Indian benchmarks figure as the standard [12]. For SSI rate, we established 2 as baseline benchmark on the basis of previous SSI rates of our own institutional record. There is no bench mark figure for SSI available from any national or international organization.
Table 10 shows cumulative data (5 years) of QI for HAI revealed that HAI rate of our institution was almost always maintained below the benchmark. Eventually, we were able to reduce the baseline benchmark and establish our new benchmark as 1 for CAUTI, 3 for VAE, 2 for CLABSI and 1 for SSI that can be used in developing HAI prevention policies by other institutions.
Table 9: Cumulative data of 5 years (2016 to 2020).
|
Type of HAI
|
Number of Infections
|
Number of device days/ number of surgeries
|
Rate
|
|
CAUTI
|
106
|
2,34,629
|
0.45
|
|
VAE
|
125
|
51,543
|
2.42
|
|
CLABSI
|
80
|
59,197
|
1.35
|
|
SSI
|
149
|
69,682
|
0.21
|
Table 10: Mapping of HAI rates of KIMS hospitals with CDC/NHSN, INICC and 2 Multicentric pooled Indian data.
|
Type of HAI
|
CDC/NHSN
Benchmark
|
INICC
Bench
mark
|
Multicentric Pooled Indian data from
4 Hospitals (NABH)
Bench
mark.
|
Multicentric Pooled Indian data from 40 hospitals by Dr Rosenthal VD
|
KIMS benchmark
|
Observed HAI rates
|
New Benchmark (After 5-year study)
|
|
CAUTI
|
2.09
|
6.5
|
1.63
|
2.1
|
2
|
0.45
|
1
|
|
VAE
|
1.43
|
19.5
|
6.74
|
9.4
|
5.5
|
2.42
|
3
|
|
CLABSI
|
1.02
|
6.12
|
2.42
|
5.1
|
3
|
1.35
|
2
|
|
SSI
|
--
|
--
|
--
|
--
|
2
|
0.21
|
1
|
Note: In the studies of CDC-/NHSN, INICC, multicentric pooled data from 4 Indian Hospitals (NABH) & 40 hospitals from 20 cities by Rosenthal VD, the term Ventilator Associated Pneumonia (VAP) was used. However, in the present study the term Ventilator Associated Event (VAE) is used.
Discussion
Centre for Disease Control/National Healthcare Safety Network (CDC/NHSN) HAI rates are globally considered bench mark of health care associated infection [15].
The International Nosocomial Infection Control Consortium (INICC) data for HAI rates are used for comparison by developing and underdeveloped countries. It is an international, nonprofit, multicentric health care–associated infection (HAI) cohort surveillance network with a methodology based on the U.S. Centers for Disease Control and Prevention's National Healthcare Safety Network (CDC-NHSN). The INICC was founded in 1998 to promote evidence-based infection control in limited-resource countries for better health care delivery [16].
A study was conducted by Rosenthal VD on device associated infection rates, among 20 cities of India from 2004 to 2013. Our organization was a part of the study. In the study, it was observed that device associated HAI rate as 5.1 CLABSI/1,000 central line days, 9.4 VAP/1,000 mechanical ventilator days and 2.1 CAUTI/1,000 urinary catheter days.
Although National guidelines on HAI prevention and control are available, there is no definite benchmark from Indian hospital is available in published journals [17].
The trend of various HAI’s in the present study are shown in Figures 1. Hence the present study aimed to find out HAI trends and to establish the benchmark figure for our institution.
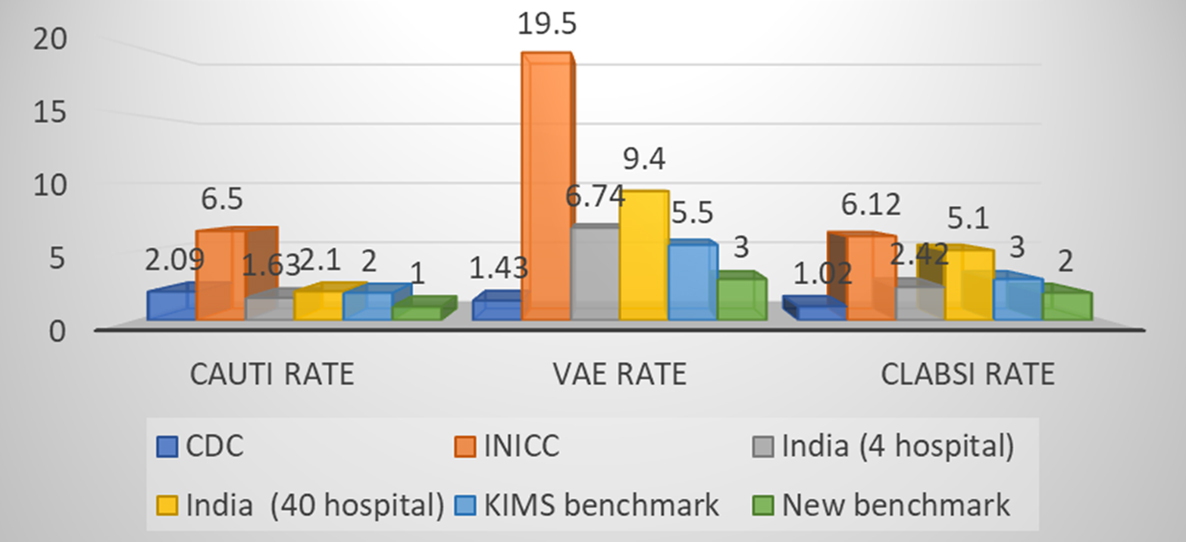
Figure 1: Comparison of various HAI rates of present study with CDC-NHSN, INICC, Indian pooled data & Observed rate.
It is evident from our study, the VAE rate is the highest among all HAIs, therefore, a matter of prime concern. In comparison to INICC data and both multicentric pooled Indian data, present study showed significantly better performance but lower performance than CDC/NHSN data (Table 10). There could be a possibility that prevalent hospital care delivery system, better infection control policies and their implementation measures in developed countries (US) are advanced than those of developing countries such as India. CLABSI rate was significantly better in our study than INICC & pooled Indian study and almost comparable with CDC/NHSN data.
The CAUTI rate was found to be much lower than VAE and CLABSI rate. Surprisingly, CAUTI rate was significantly lower in our study findings as compared to Indian hospital benchmarks, INICC benchmark and even CDC/NHSN benchmark. SSI rate was found lower than our institutional standard benchmark although SSI surveillance was the most challenging to conduct among all HAI types.
Conclusion
Findings of our study revealed, gradual reduction in major HAI rates in the institution, which further suggest that the existence of evidence-based guidelines results in better infection control in the hospital. This information (HAI trends and benchmark) may further help to formulate the infection control policies for implementation of effective hospital infection prevention & control practices and antimicrobial stewardship at the institutional level in India.
Acknowledgement
We thank Ms. Lavanya Sirikonda, Jr. Computer Operator for Hospital Infection Control (HIC), KIMS hospital, Secunderabad for maintaining the Quality Indicator data.
Conflicts of interest
Authors declare no conflicts of interest.
*******************************************************************************************************************************
Supplemental Figures:
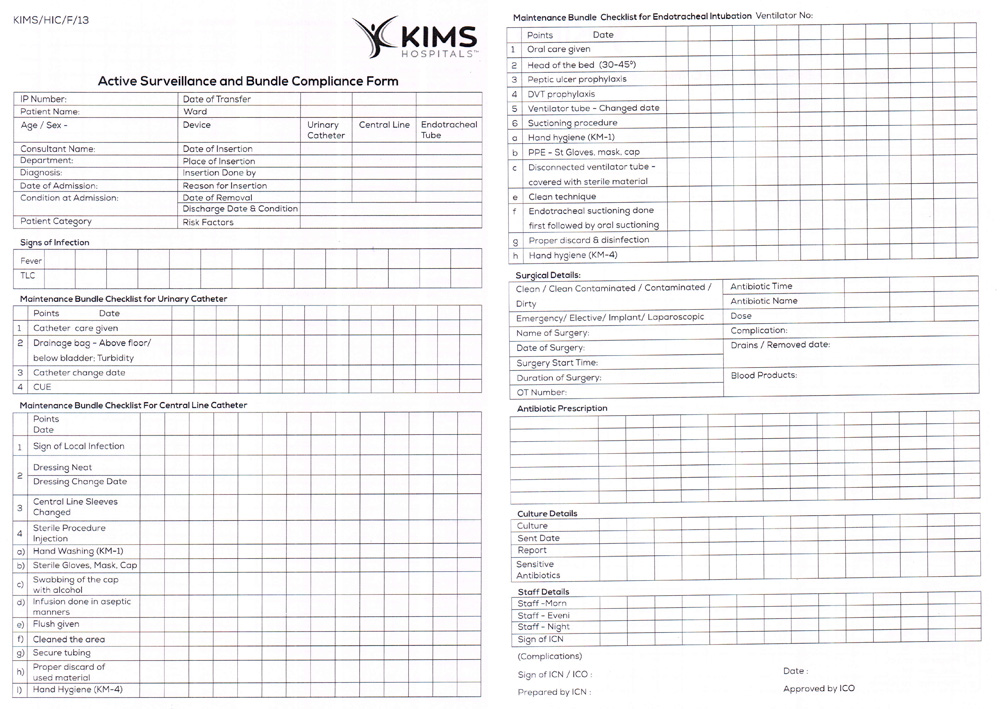
Supplemental Figure 1: Active surveillance Form.
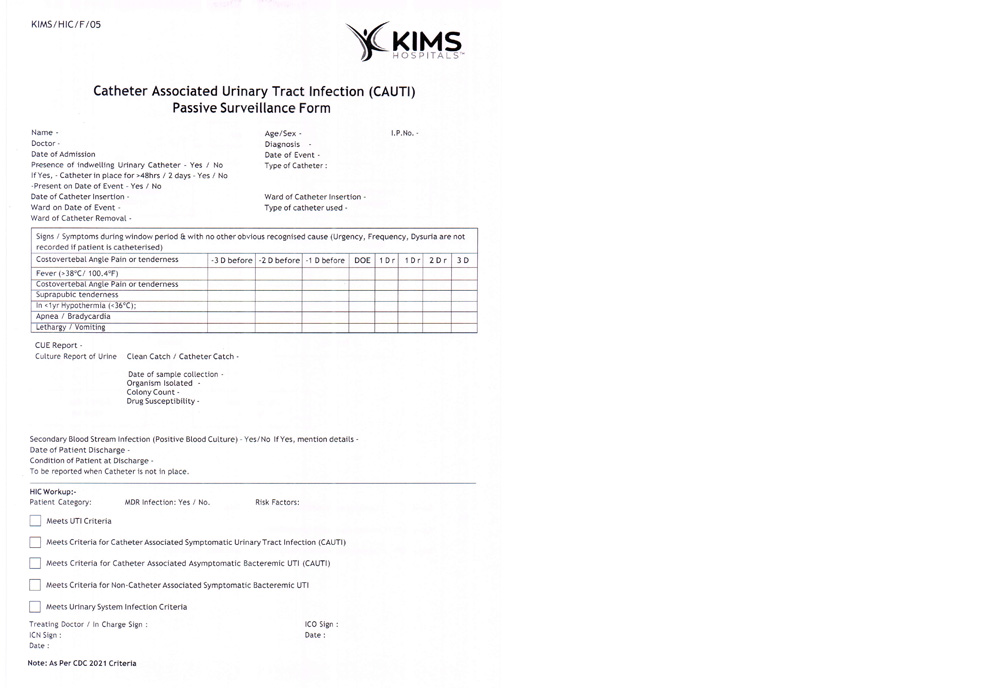
Supplemental Figure 2: Passive surveillance form of CAUTI.
Supplemental Figure 3: Passive surveillance form of VAE.
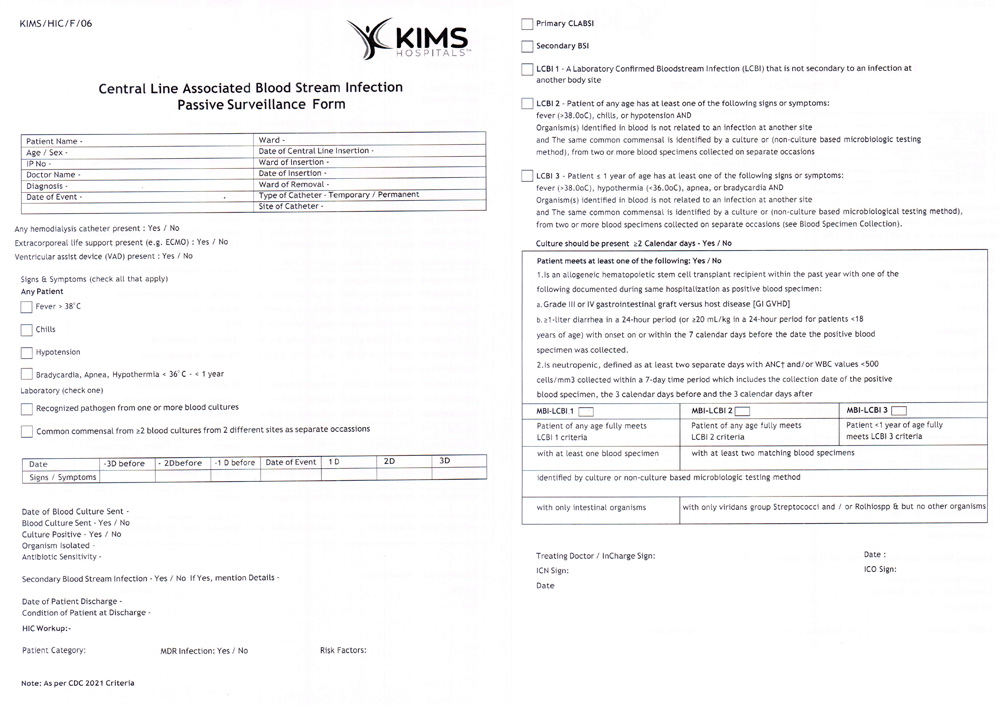
Supplemental Figure 4: Passive surveillance form of CLABSI.
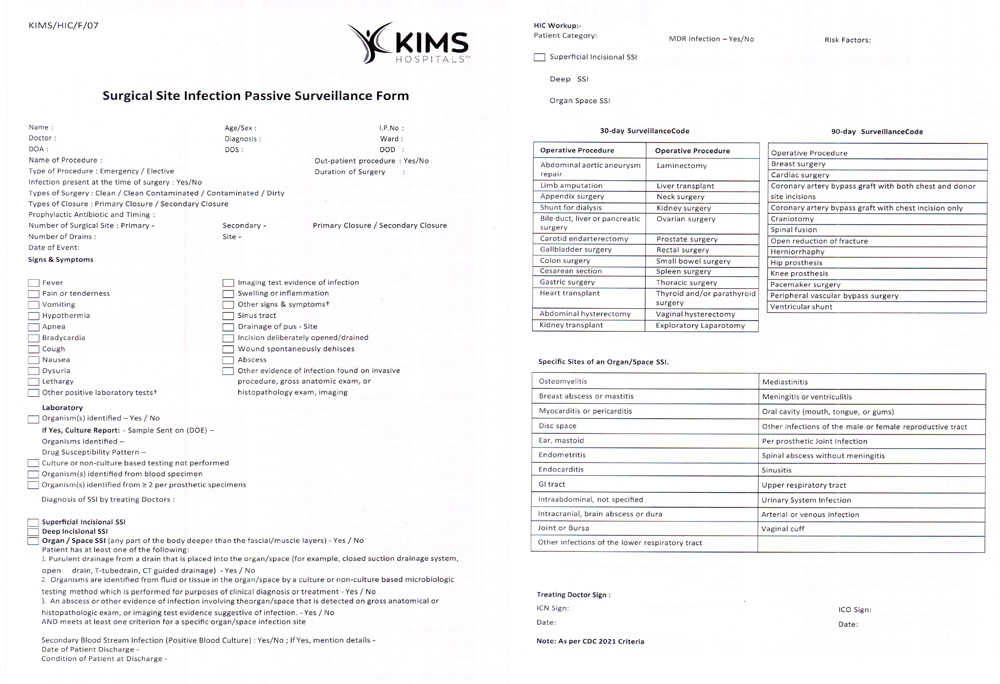
Supplemental Figure 5: Passive surveillance form of SSI.
References
[1] Ministry of Health and Family Welfare Government of India. National Guidelines for Infection Prevention and Control in Healthcare Facilities. National Centre for Disease Control, Directorate General of Health Services Ministry of Health and Family Welfare, Government of India, January 2020. Available from: https://cdn.who.int/media/docs/default-source/searo/india/antimicrobial-resistance/ipcguidelines-web-sep2020.pdf?sfvrsn=9e77fcb0_2
[2] Foxman B. Epidemiology of urinary tract infections: incidence, morbidity and economic costs. Am J Med. 2002; 113(Suppl 1A):5S–13S.
[3] Kamat US, Fereirra A, Amonkar D, Motghare DD, Kulkarni MS. Epidemiology of hospital acquired urinary tract infections in a medical college hospital in Goa. Indian J Urol. 2009; 25(1):76–80.
[4] Centres for Disaese Control and Prevention 2019. National Healthcare Safety Network (online). Available from: https://www.cdc.gov/nhsn/index.html/.
[5] Sastry SA, Deepashri R. Text Book. Essential of hospital infection control. Haryana: Jaypee Brothers Medical Publishers (P) Ltd, 2019. Chapter 4, Surveillance of Healthcare-associated Infections; Page 90.
[6] Centres for Disaese Control and Prevention 2017. National Healthcare Safety Network. Pneumonia (Ventilator-associated (VAP) and non-ventilator-associated Pneumonia (PNEU) Event. Available from: https://www.cdc.gov/nhsn/pdfs/pscmanual/6pscvapcurrent.pdf
[7] Centres for Disaese Control and Prevention 2018. National Healthcare Safety Network. Ventilator Associated Event (VAE). Available from: https://www.cdc.gov/nhsn/pdfs/pscmanual/10-vae_final.pdf
[8] Centres for Disaese Control and Prevention 2018. National Healthcare Safety Network. Bloodstream Infection Event (Central Line-Associated Bloodstream Infection and Non-central Line Associated Bloodstream Infection). Available from: https://www.cdc.gov/nhsn/pdfs/pscmanual/4psc_clabscurrent.pdf
[9] Zimlichman E. Health Care Associated Infections. A Meta -analysis of Costs and Financial Impact on the US Health Care System. JAMA Intern Med. 2013; 173(22):2039–2046.
[10] Sastry SA, Deepashri R. Text Book. Essential of Hospital Infection Control. 1st ed. Haryana: Jaypee Brothers Medical Publishers (P) Ltd, 2019. Chapter 4, Surveillance of Healthcare-associated Infections; Page 103.
[11] National Accreditation Board for Hospitals and Healthcare Providers (NABH). Accreditation Standards for Hospitals. 4th Edition guidebook. Chapter 5, Hospital Infection Control (HIC) Page 54–62.
[12] Singh S, Chakravarthy M, Sengupta S, Munshi N, Jose T, et al. Analysis of a multi-centric pooled healthcare associated infection data from India: New insights. The Journal of National Accreditation Board for Hospitals & Healthcare Providers. 2014; 1(2):39.
[13] Centres for Disaese Control and Prevention 2016. National Healthcare Safety Network. Urinary Tract Infection (Catheter-Associated Urinary Tract Infection (CAUTI) and Non Catheter-Associated Urinary Tract Infection (UTI) and other Urinary System Infection (USI) events.
[14] Centres for Disaese Control and Prevention 2016. National Healthcare Safety Network. Surgical Site Infection (SSI) events. Procedure-associated Module.
[15] Emori TG, Culver DH, Horan TC, Jarvis WR, White JW, et al. National Nosocomial Infection Surveillance System (NNIS): Description of surveillance methods. Am J Infect Control. 1991; 19(1):19–35.
[16] Rosenthal VD, Maki DG, Mehta A, Alvarez-Moreno C, Leblebicioglu H, et al. International nosocomial infection control consortium report, data summary for 2002-2007, issued January 2008. Am J Infect Control. 2008; 36(9):627–637.
[17] Mehta Y, Jaggi N, Rosenthal VD, Kavathekar M, Sakle A, et al. Device-associated infection rates in 20 cities of India, data summary for 2004–2013: findings of the international nosocomial infection control consortium. infection control & hospital epidemiology. 2016; 37(2):172–181.